Heston Model Calibration
Here are some quick graphs from recent experiments in calibration of a Heston model to observed option prices (in this case options on the DAX index). They are offered with only the briefest of explanations below for the time being, but there should be more coming soon; or if you wish, get in touch with me at webs@bnikolic.co.uk.
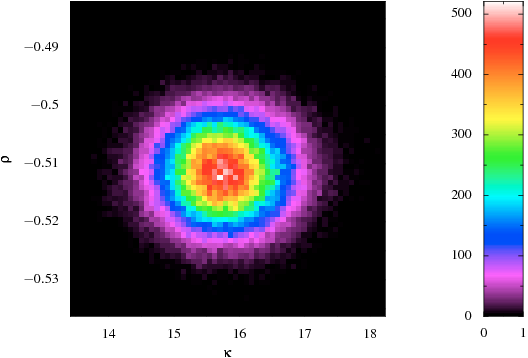
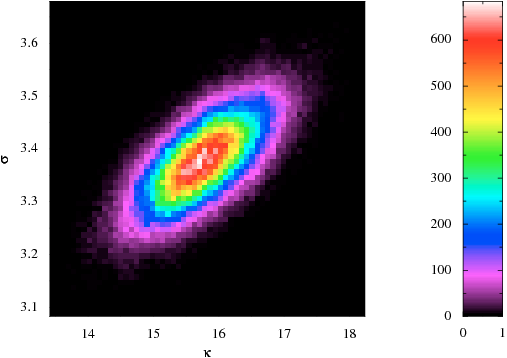
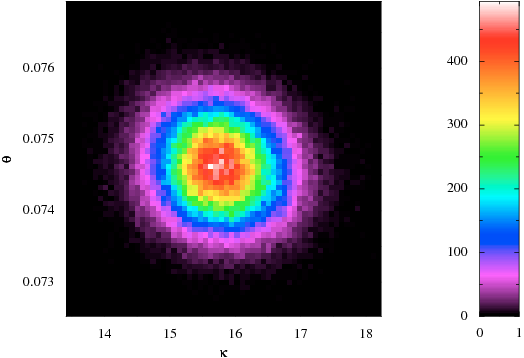
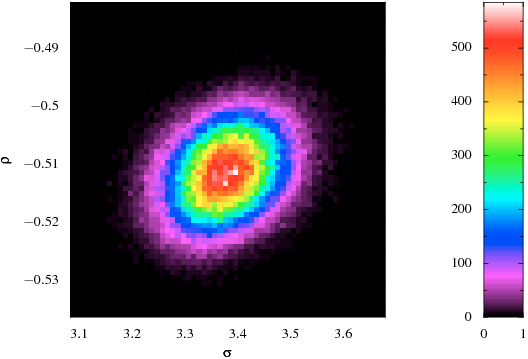
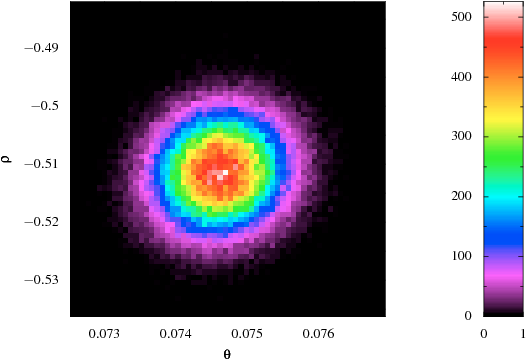
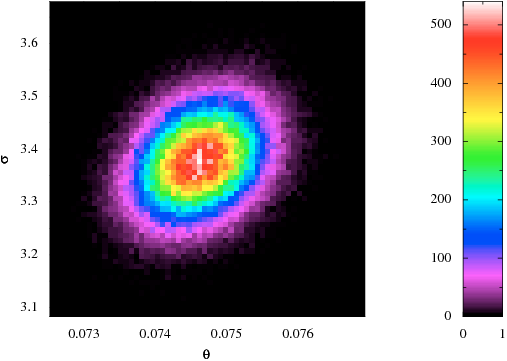
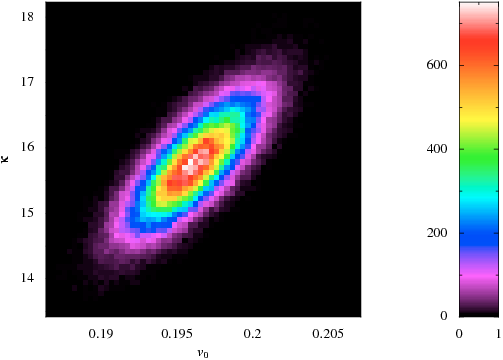
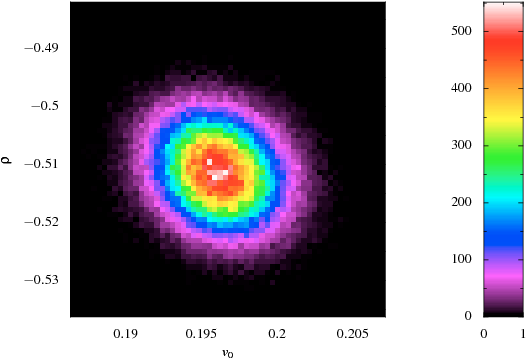
The analysis was carried out by treating the calibration as a standard inference problem. In this case I assumed a Gaussian likelihood on the difference in implied volatility between the Heston model and the market prices and with the characteristic error of 0.5bp.
The parameters in the plots have the usual meaning:
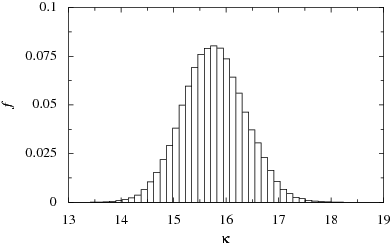
- Kappa is the damping of the mean reversion of the variance
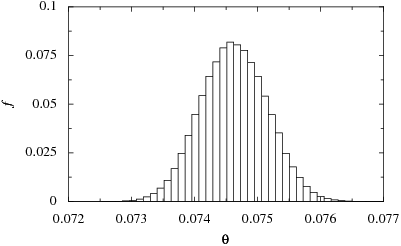
- Theta is the mean reversion level of the variance
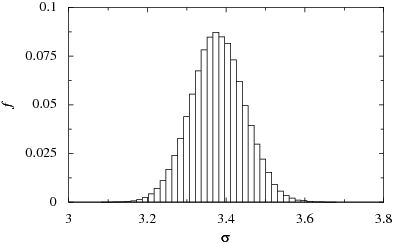
- Sigma is the volatility of the variance
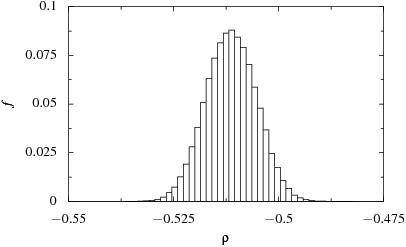
- Rho is the correlation between the spot and variance processes
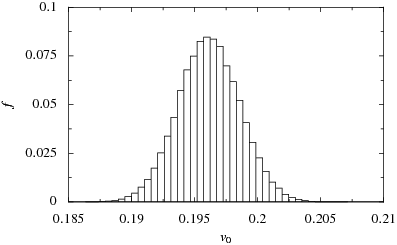
- V0 is the spot variance
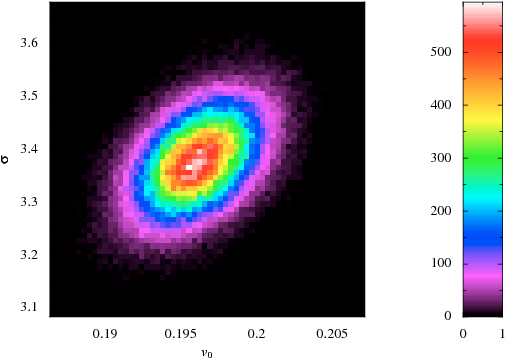
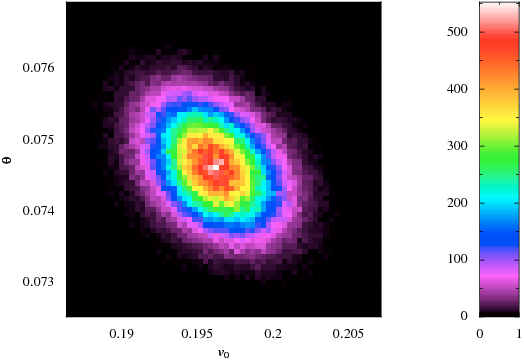
These are the marginalised distributions of each of the parameters:
And these are the two-parameter marginalised distributions:
