Counting FLOPS and other CPU counters in Python
On the Linux command line it is fairly easy to use the perf
command to measure number of floating point operations (or other
performance metrics). (See for example this old blog post ) with this approach it is not easy to get
a fine grained view of how different stages of processings within a
single process. In this short note I describe how the
python-papi package can be used to measure the FLOP requirements
of any section of a Python program.
Installation
The package is available from pypi so you can install it in the usual way:
pipenv install python-papi
If you don’t use pipenv, replace with your normal Python package
management scheme.
If you are not running root (which of course you should not be), it is necessary to ensure the kernel paranoid switch is set appropriately:
sudo sh -c 'echo 1 >/proc/sys/kernel/perf_event_paranoid'
Note that the floating point counters are available on many recent Intel processors, however they are not supported on Haswell architecture (e..g, the v3 Xeon processors). They work on Ivy & Sandy Bridge and Broadwell and subsequent architectures.
Note If you get a
PAPI_ENOEVNTerror then most likely the CPU you are using does not support the right counters. In this case you will need to do your testing on another CPU. In case you are counting Floating Point Operations, this count should depend on the algorithm itself rather than the CPU, so a measurement on any CPU is sufficient for understanding the algorithm.
_Note I have not been able to make PAPI work on any virtualisation system (although it may be possible). If need be, AWS (for example) offers bare metal instances on which PAPI definitely does works.
_Note You can check capabilities being requested by a process using a
strace -e capgetcommand. Use this to debug permission problems for performance monitoring
_Note The PyPAPI programming interface has changed since this post has been published and the examples below do not work verbatim!
_Note Since Python v3.12 there is an integration between Python and the linux perf tools, see https://docs.python.org/3/howto/perf_profiling.html
Usage
The counters can be used very easily, e.g.:
from pypapi import events, papi_high as high

high.start_counters([events.PAPI_FP_OPS,])
# Do something
x=high.stop_counters()
and the number of floating point operations will be in the variable
x. Fuller documentation for PAPI is available at here.
Example
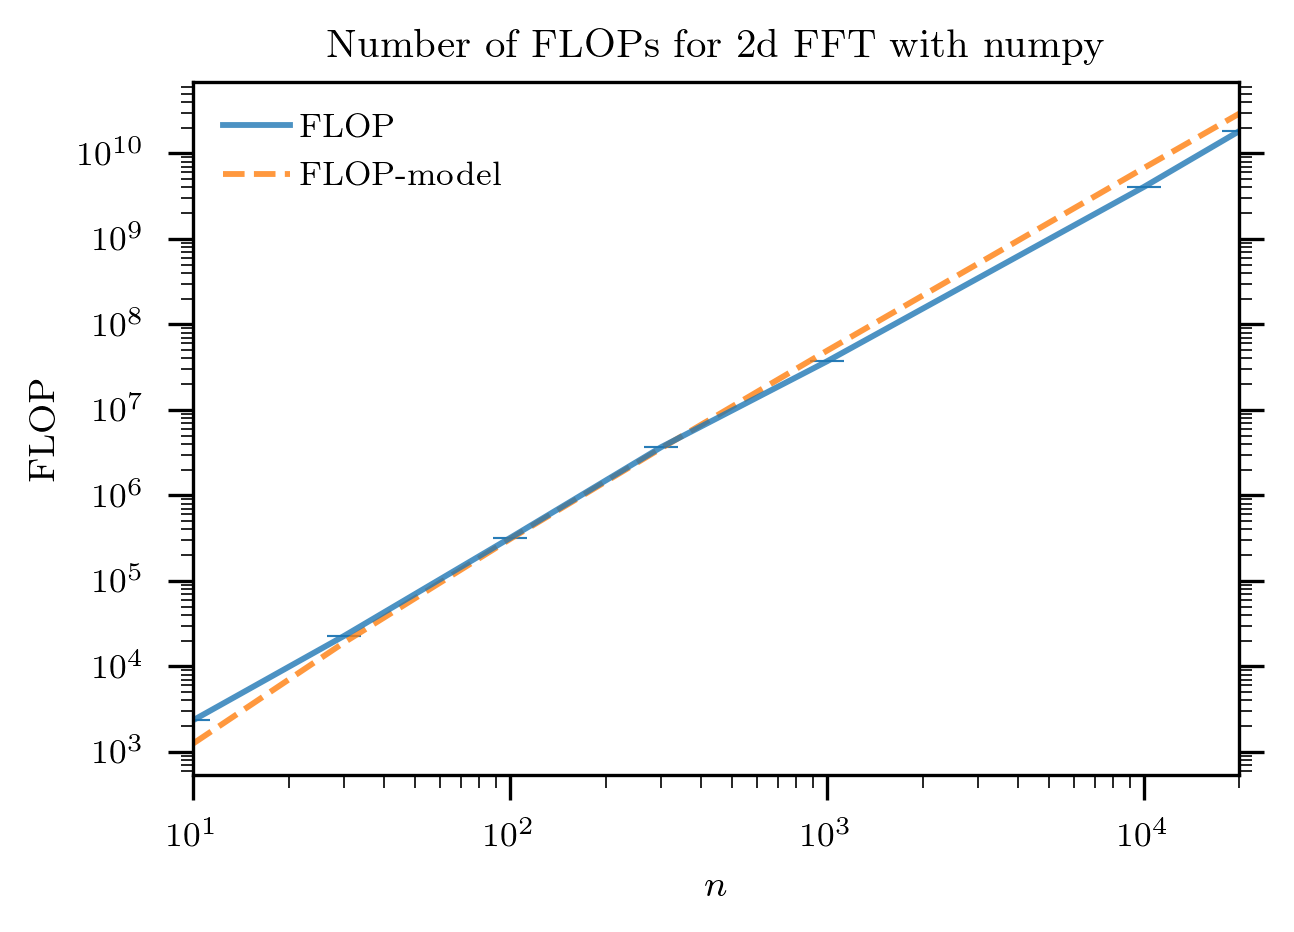
As a simple example, I count here the number of floating point
operations used to compute numpy.fft on a two-dimensional
array.
The measurement code is as follows:
for n in [10, 30, 100, 300, 1000, 10000, 20000]:
    aa=numpy.mgrid[0:n:1,0:n:1][0]
    high.start_counters([events.PAPI_FP_OPS,])
    a=numpy.fft.fft(aa)
    x=high.stop_counters()
    print (n, x) # Or record results in another way
The results are plotted below:

together with the model: 4*numpy.log(n**2)*n**2-6*n**2 + 8. It
can be seen that this model is fairly close to the number of
operations as captured by the CPU performance monitoring unit.
Other Examples See for example the post applying this to PyTorch and insight that can be derived and a roofline-like model
Need further advice? With over 20 years of experience with numerical processing in Python – from numeric/numarray through to PyTorch and Jax – we are uniquely placed to help! Contact us at webs@bnikolic.co.uk