PyTorch Neural Networks on CPU: 'roofline' for branching-limited models
In previous post previous post I looked at CPU performance monitoring unit measureemnts of a set1 of PyTorch models and showed that concentration of branching instructions seemed to determine performance. Here I take the same measurements and use them to construct a plot form a which a simple model for the limitation of performance can be constructed.
The approach is essentially the same as the `roofline’ analysis as introduced by Williams, Waterman and Patterson2 but focus is on latency and pipeline stalls introduced by branching instructions rather than memory bandwidth.
The plot tells the story:
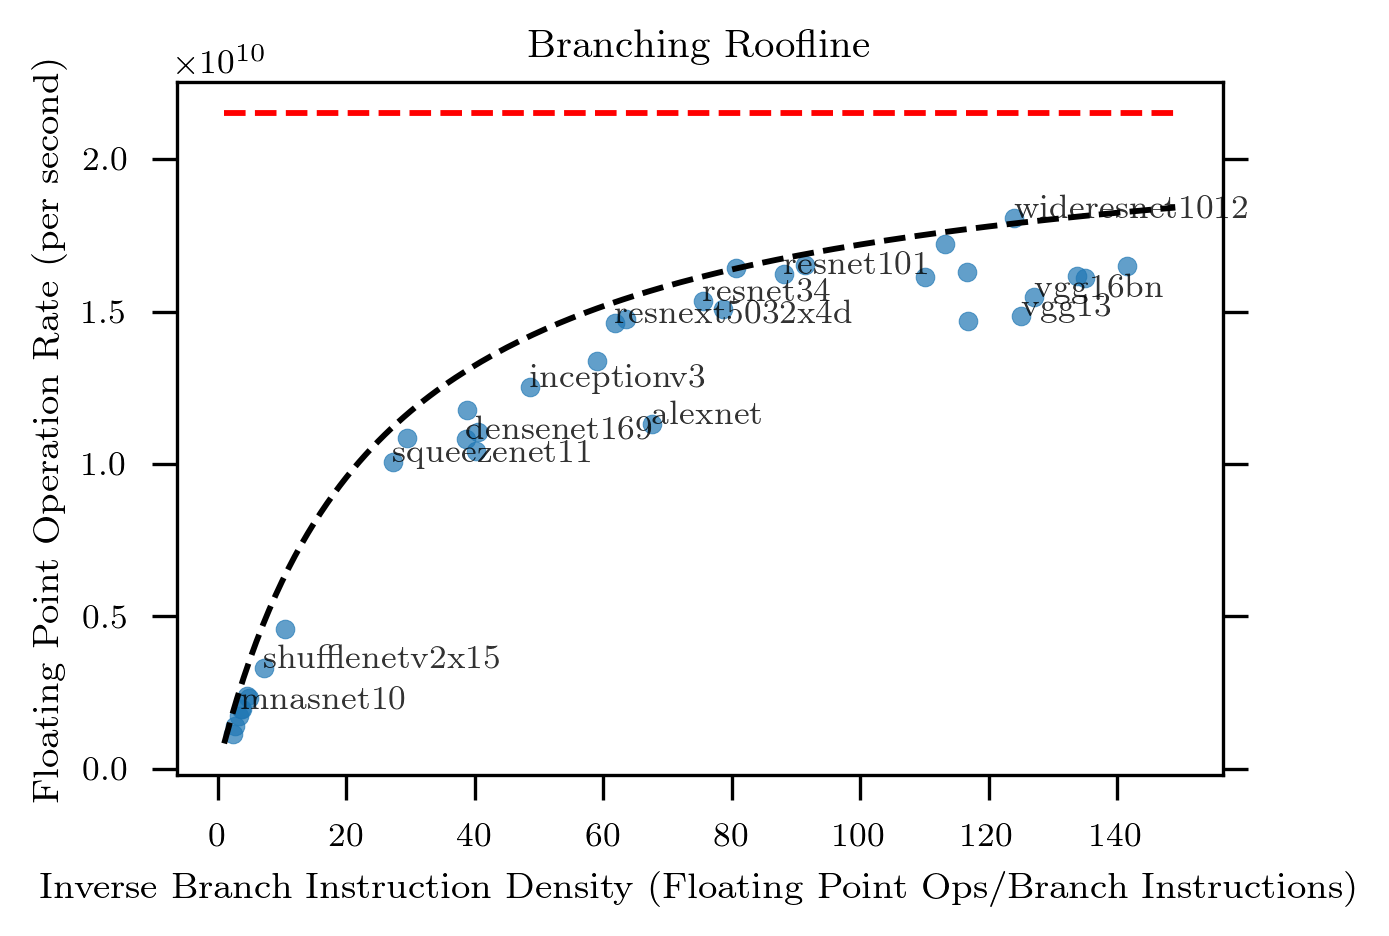
The data are the same as previously but the abscissa is now the concentration of the branching instructions, i.e., the number of branching instructions divided by the number of floating point operations.
Also marked on the plot are:
- The maximum achievable single-thread FLOPS rate as the dashed red
line. This was measured on this processor through profiling the
torch.matmultfunction. -
A model of parametric form (black dashed line):
\[\frac{21.5\times10^9}{1+25/\rho}\]where \(\rho\) is the concentration of branching instructions and the nominator \(21.5\times10^9\) is the observed maximum FLOPS rate (i.e., the level of the red dashed line).
This model was selected by eye to explain the apparent limiting line.
How can this be interpreted? Some things to keep in mind:
-
The pipeline of this Ivy Bridge processor is 14-19 deep
-
The processor apparently retires about 7 floating point operations per cycle (i.e., maximum floating point operations per second rate divided by the maximum 3.1 GHz clock speed)
-
Only a fraction branching instructions will result in a stall – others will be correctly speculatively executed
Given this a pipeline stall will result in about 100 lost floating point operations (i.e., \(7\times15\)), while the model has a characteristic concentration of 25. This suggests roughly 75% of branches are correctly speculatively executed in this simplified view.
Other models and explanations could probably be constructed, but I leave at this for this (speculative!) post.
Footnotes:
-
Not necessarily a representative set of models – or input data size! Note also such an analysis depends on the precise CPU used etc. You should redo the analysis carefully in a way that reflect your own problem before relying on the results ↩
-
Communications of the ACM, 52:4, April 2009, DOI:10.1145/1498765.1498785 ↩