A dubious relationship
Here I look at the relationship between the UK unemployment rate and the quantity of credit to consumers written off by financial institutions each quarter. The inspiration for this short article is this tweet by Keith Chruch. Although broadly looking at the same metrics I did not reproduce exactly his numbers so what I write here may not apply to his analysis. And of course any errors are my alone.
Specifically the goal is to look at any linear relationship between annual change in unemployment versus the writeoff amounts after applying a suitable lag to the credit data. I wanted to do this using Beysian linear regression with a mixture model of the probability distributions (along the lines described in this post).
First look
The credit write offs I calculated as sum of the credit card and “other” credit writeoffs, both totals for each quarter. The unemployment rate is from the ONS surve (see below for the detailed data sources). Here are the data visualised without differencing to compute the change in unemployment and presented as in their time order:
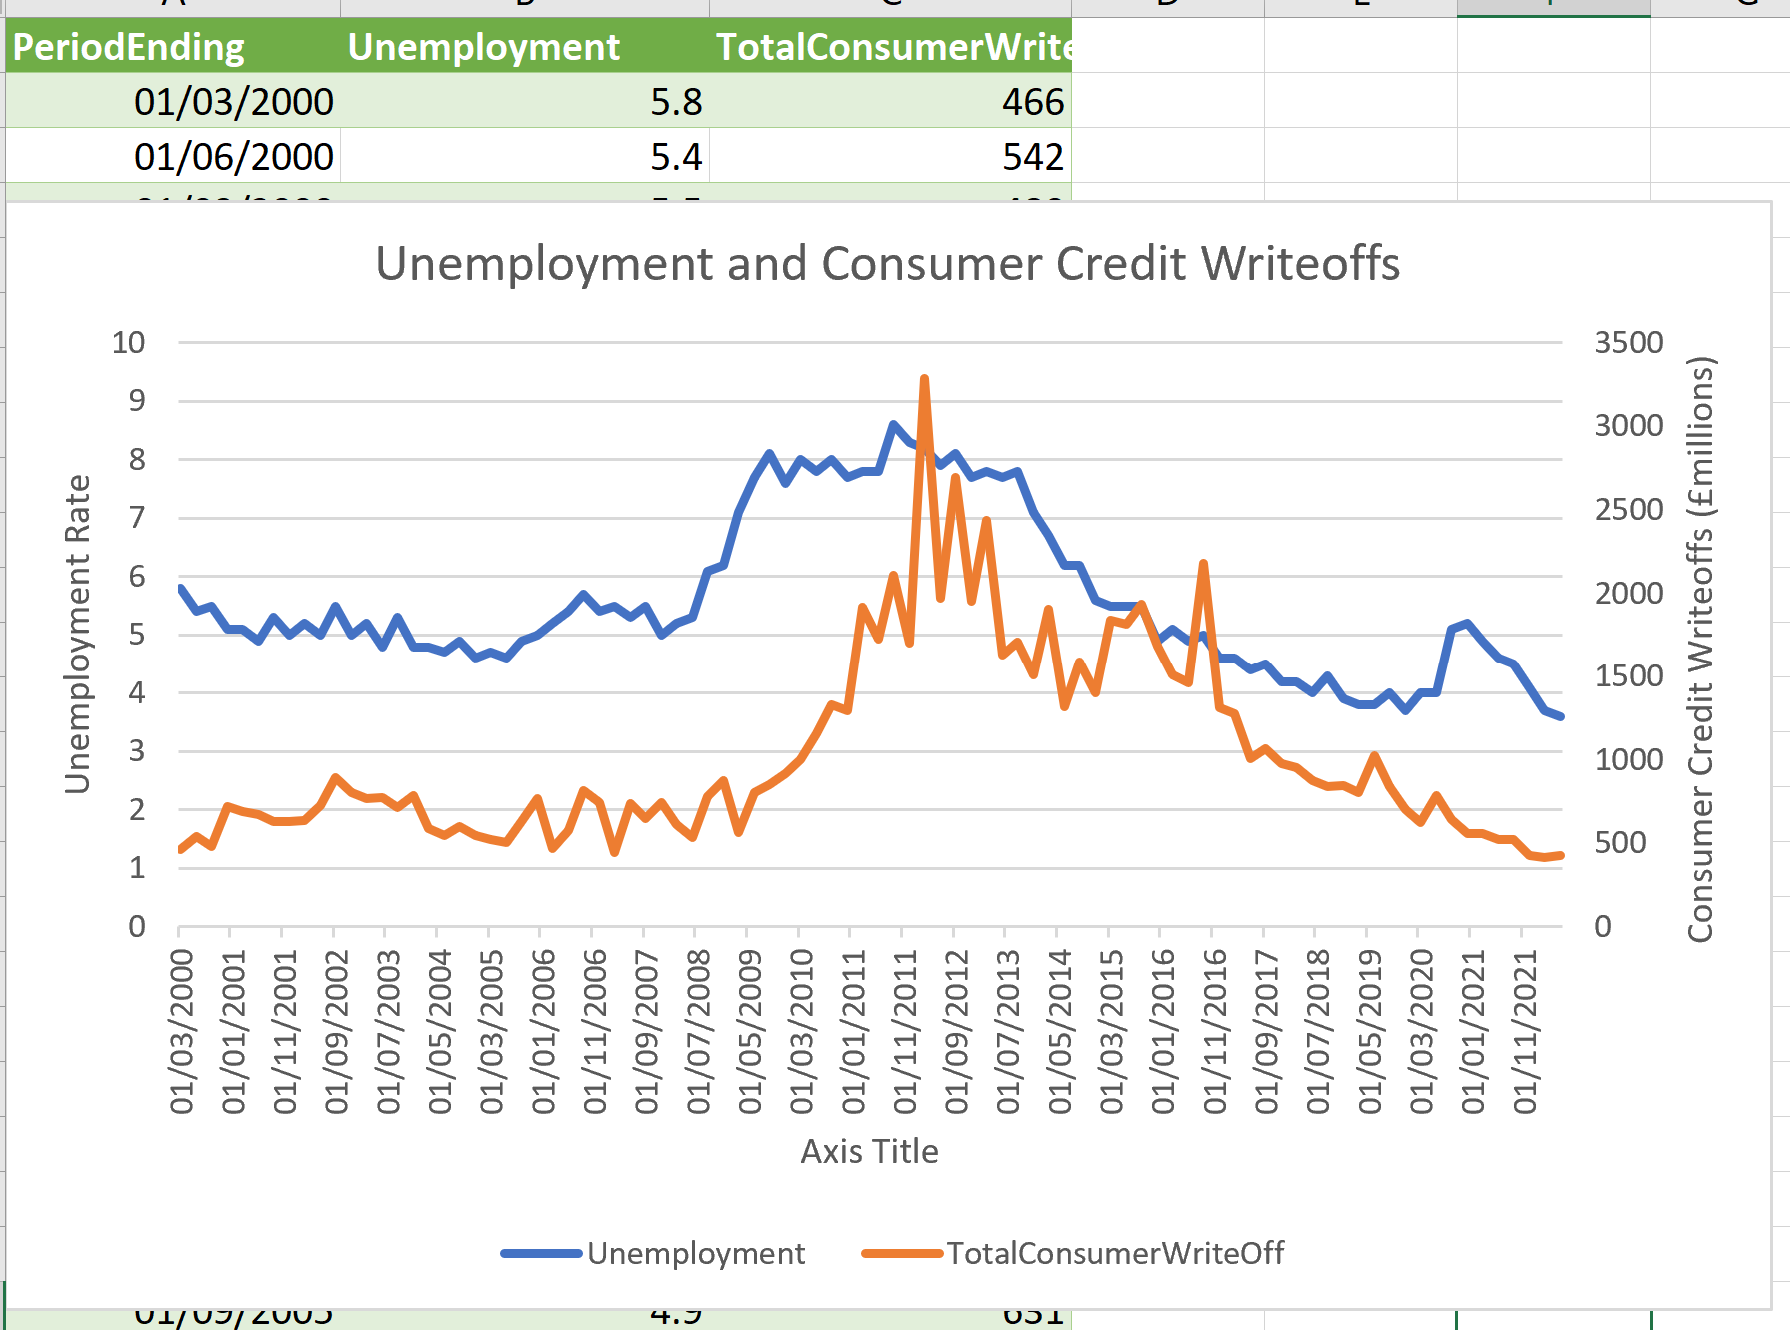
The dominant feature seen in both unemployment and credit is the 2007 credit crisis and the long recovery from it. Unemployment also shows a clear feature during COVID-19 pandemic starting in 2020 (when impact begun to be felt in UK).
Looking at the change in unemployment
Computing the change in unemployment we can see a clear lagged correlation around the 2007 credit crisis and less obvious correlation/no correlation elsewhere with a noticable lack of uptick following COVID-19 (at least for now!) :

Dropping the time information
The above time-series give a good picutre of what is going on but to do a quanttitive regression I drop the time axis and show the scatter plot of points:
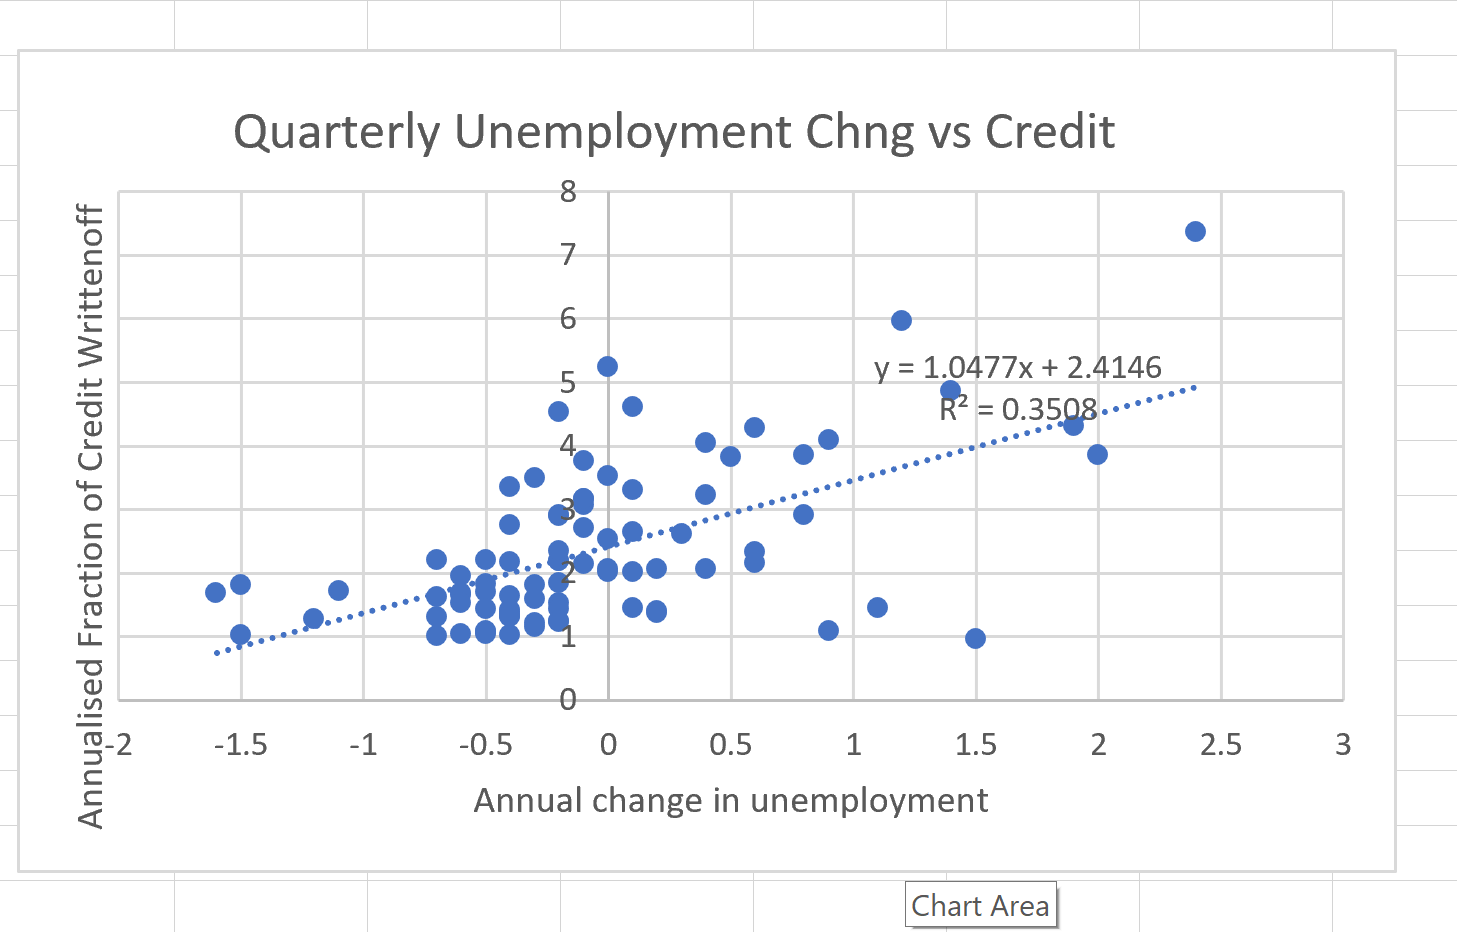
Also shown on the plot is the Excel computed trend line.
A bayesian regression
The above is all very traditional, now onto the somewhat novel bit: applying Bayesian inference to these data. The approach is very similar to the already referenced post, and references within it.
In both cases a linear model is fit:
\[ \hat{y} = m x + b \]
In first the errors are modelled as Gaussian with \(\sigma = 0.1\):
\[ Y \sim \hat{y} + \mathcal{N}(\sigma, 0) \]
In the second case errors are from a mixed distribution
\[ Y' \sim \hat{y} + Q \mathcal{N}(\sigma, 0) + (1-Q)\textrm{Cauchy}(\gamma, \mu) \]
with \(\sigma = 0.1\), the prior \(Q\) is uniform \(0<Q<0.1\), prior for \(\mu\) is normal centred at zero and with 3 (percent), and prior for \(\gamma\) is half-normal with width 3%.
Results with Gaussian-only errors
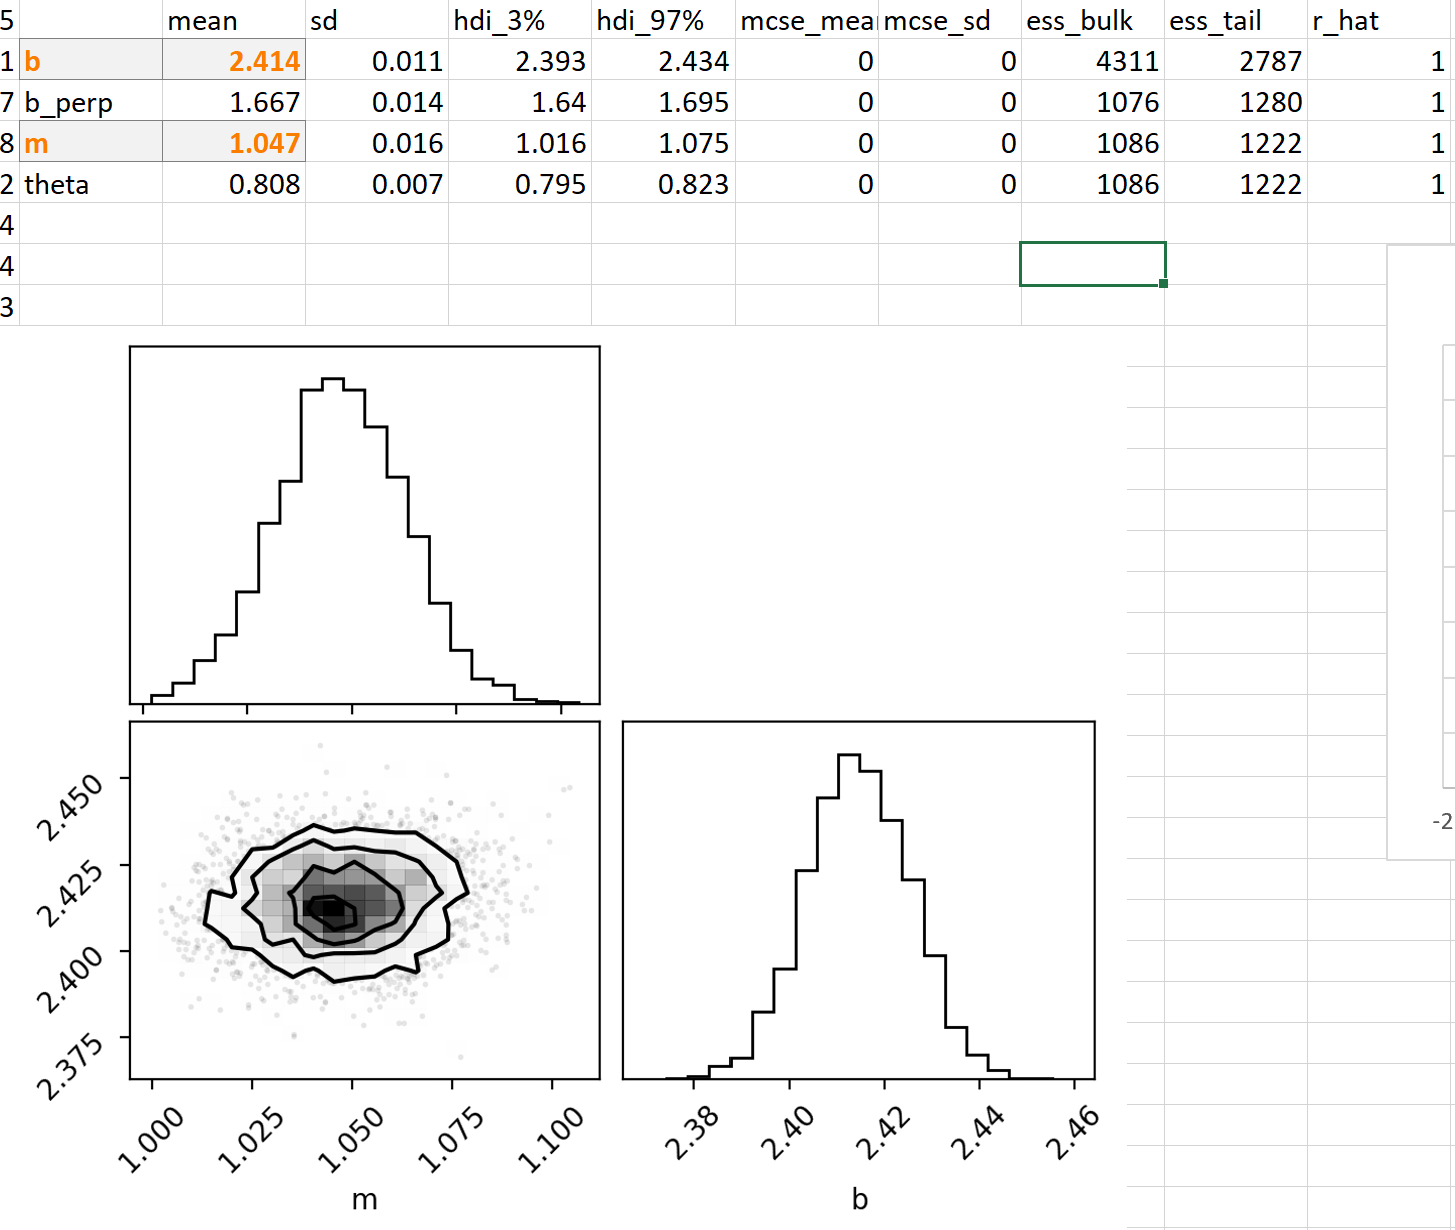
It can be seen that:
Both the slope \(m\) and intercept \(b\) (highlighted in the table) are very similar to the Excel trendline
The posterior distribution is well-behaved
Uncertainties in \(b\) and \(m\) are small (around 0.02 in each)
Results under mixed-distribution errors
The assumption here is that up to 10% of the data points could be contaminated with Cauchy-distributed fat-tailed error.
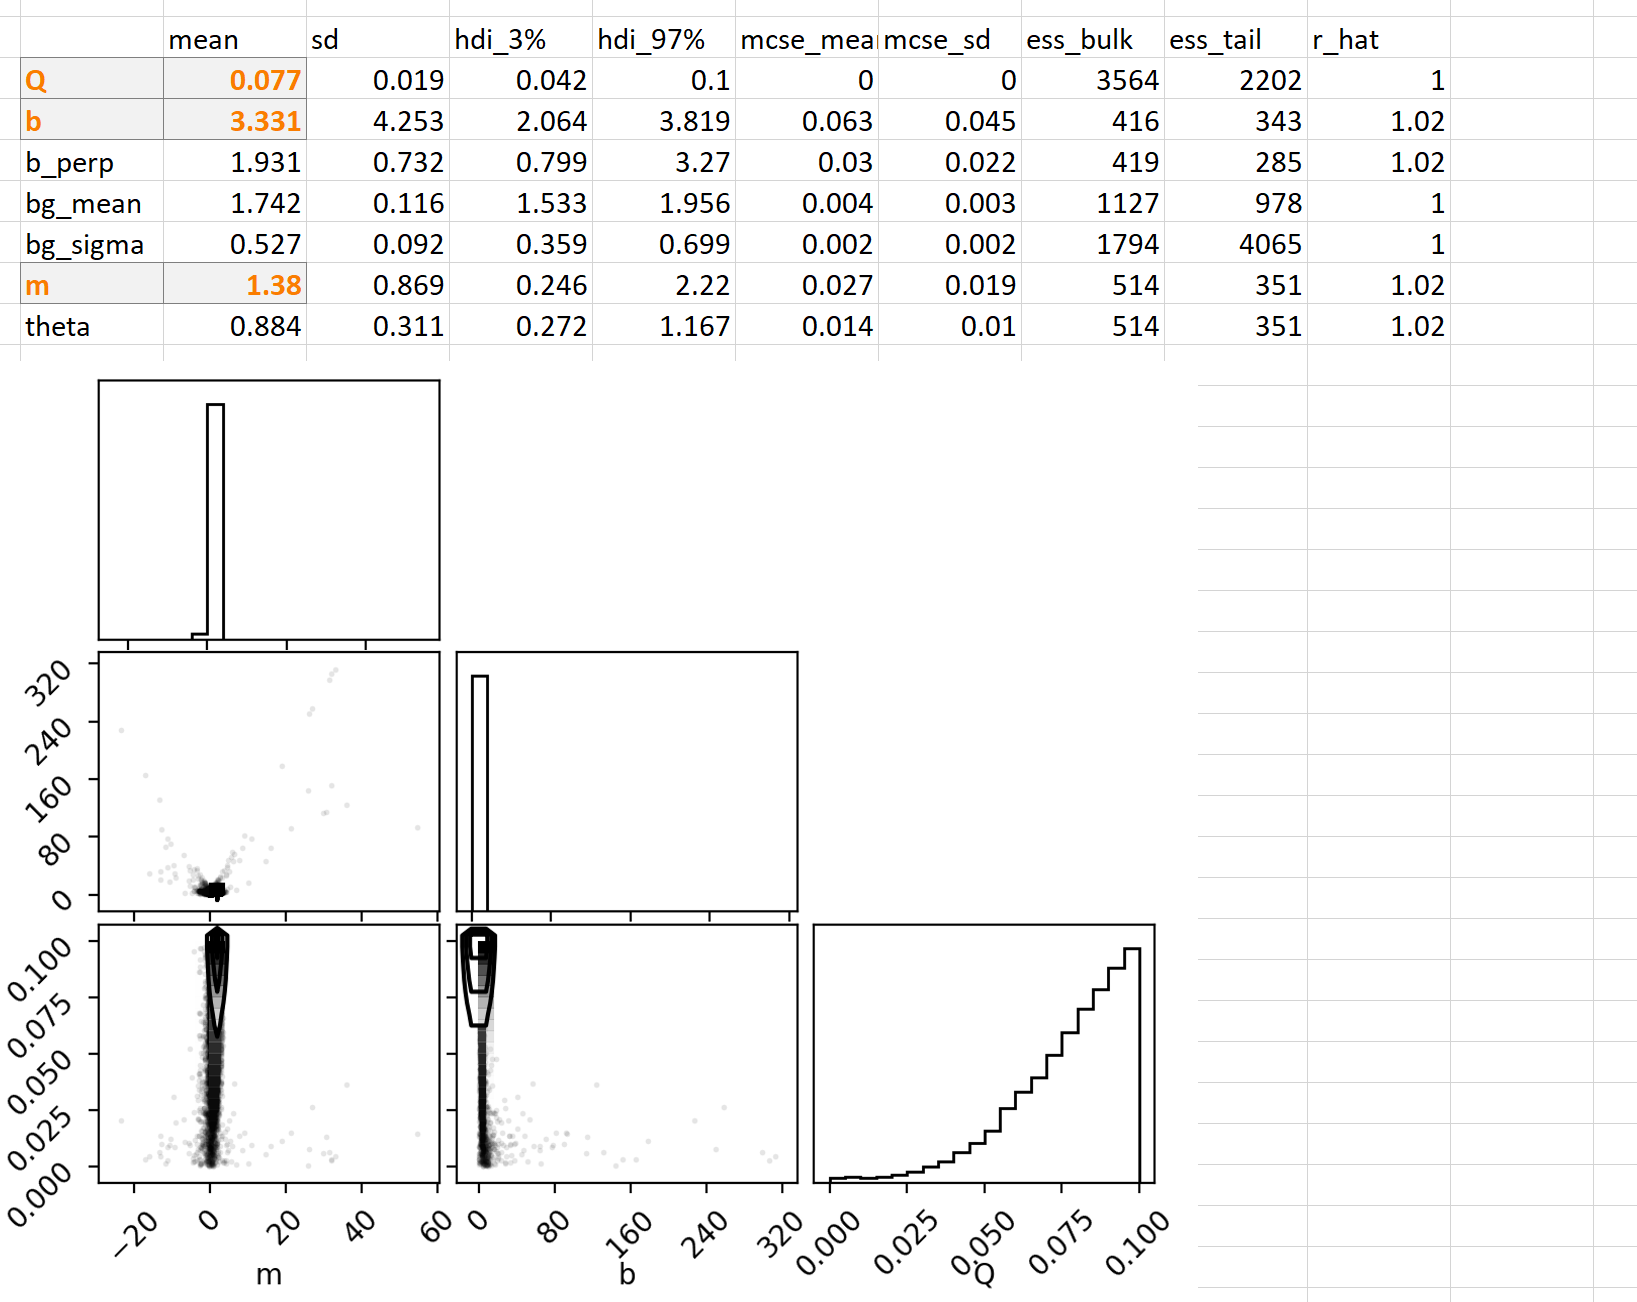
We can see:
The fraction of points inferred to have the Cauchy noise is tending towards the prior maximum (10%)
The values intercept and slope are different and have very large inferred error (slope is +/- 1 and intercept +/- 4)
The posterior is complex
Remarks
When we allow the possibility that up to 10% datapoints in this dataset are subject to a fat-tailed (Cauchy) deviation we can see that we can say very little with confidence about any underlying linear relationship between unemployment change and credit writeoffs.
This is consistent with a visual impression that the apparent relationship between the two is driven only by the data in the 2007 credit crisis period.
The dataset is a nice illustration of allowing for a mixed error distribution, allowing a systematic search for underlying relationship that is not biased by a short-term event or a few outliers.
Data used
UK ONS LFS Table A02: Labour Force Survey Summary: People by economic activity for those aged 16 and over and those aged from 16 to 64 (not seasonally adjusted). Date of publication: 16 August 2022
BOE RPQTFHE: Quarterly amounts UK resident monetary financial institutions’ sterling write-offs of credit card lending to individuals (in sterling millions) not seasonally adjusted. Accessed 1st Sept 2022
BOE RPQTFHF Quarterly amounts UK resident monetary financial institutions’ sterling write-offs of other lending to individuals (in sterling millions) not seasonally adjusted link
BOE LPQBI2P: Quarterly amounts outstanding of total (excluding the Student Loans Company) sterling consumer credit lending to individuals (in sterling millions) not seasonally adjusted. Accessed 5th Sept
Copyright: B. Nikolic 2024. For general information only. Not to be relied for any purpose. Not advice about investment. No warranty of any kind. No liability for any use of this information accepted.