The Few Principal Components of Yield Curves
This is a simple application of the Principal Component Analysis (PCA) in Excel technique as shown in this earlier blog post, using xlwings to connect Python to Excel and the scikit-learn implementation of PCA. I’m showing the standard PCA analysis of spot yield curves, as widely used, e.g., this note by Moody’s, by Federal Reserve and by IMF, and inspired by this short Meidum Post.
Input data
The starting point are the Bank of England archival monthly Gilt (UK Govmnt Bond) yield curves for the period 1970 to 2015. I am using maturities from 1.5 to 16.5 years which have data throughout this period. This historical period consists of a wide variety of economic conditions including periods of rapid expansion, de-industrialisation, IMF bailout, privatisation, home-ownership boom, house price inflation, public sector expansion, deep financial crisis and consequent stagnation (although UK has had the great benefit of stable institutions, the financial situation has been rather less stable!).
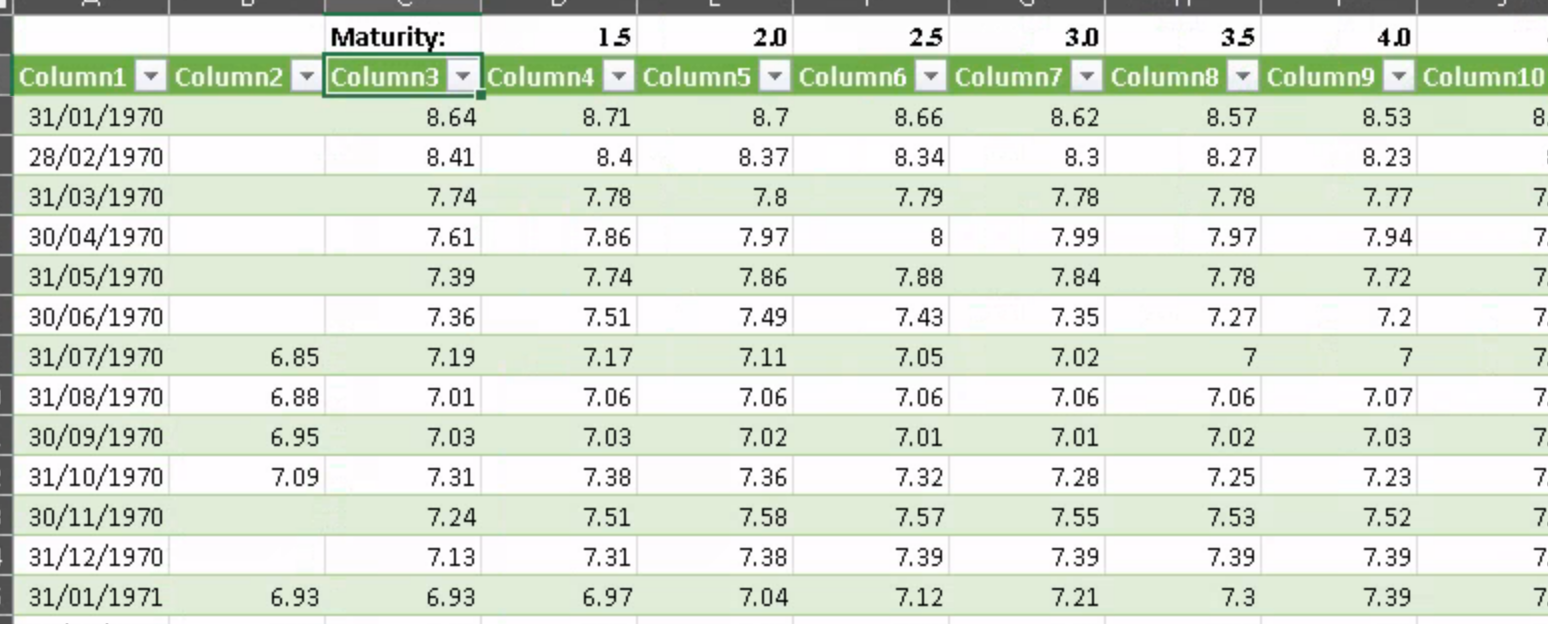
The data are available from BoE and can be easily imported in Excel. I’m connecting to them as a live CSV data source so that they can be easily updated:

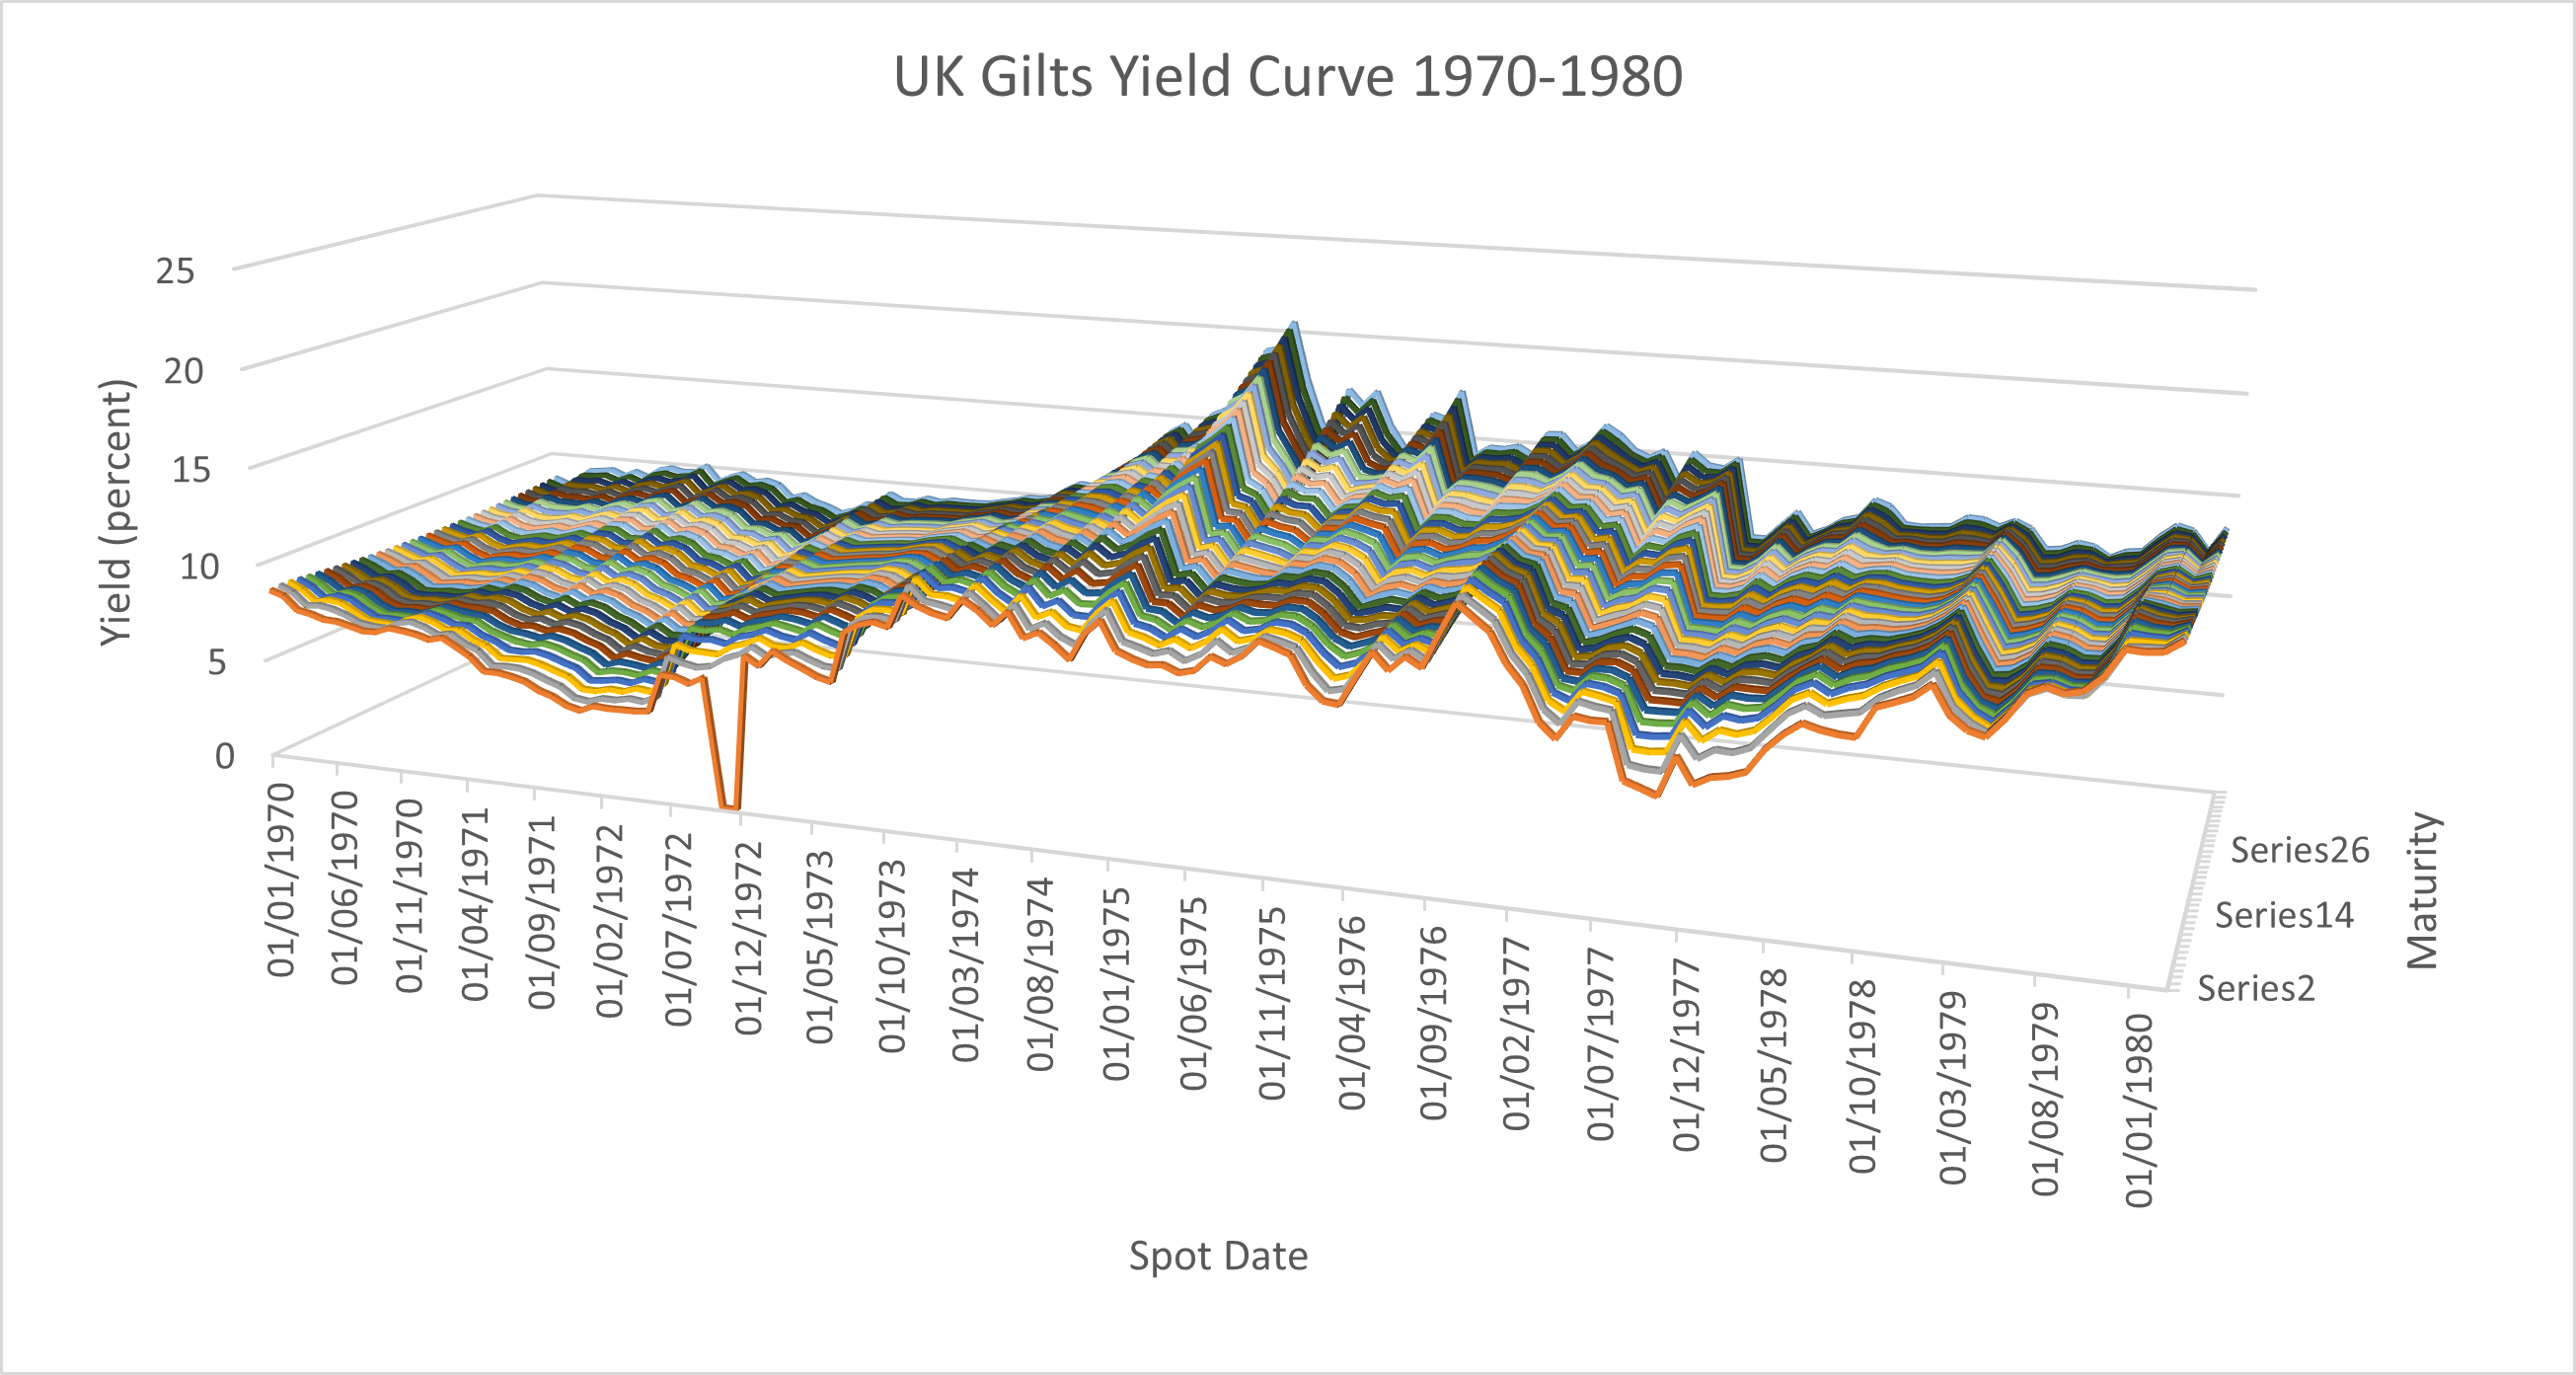
A plot of the yield curves for the period 1970-1980 is shown below illustrating a range of conditions including the inverted curve in the period around the IMF loan and associated crisis:

Principal component analysis
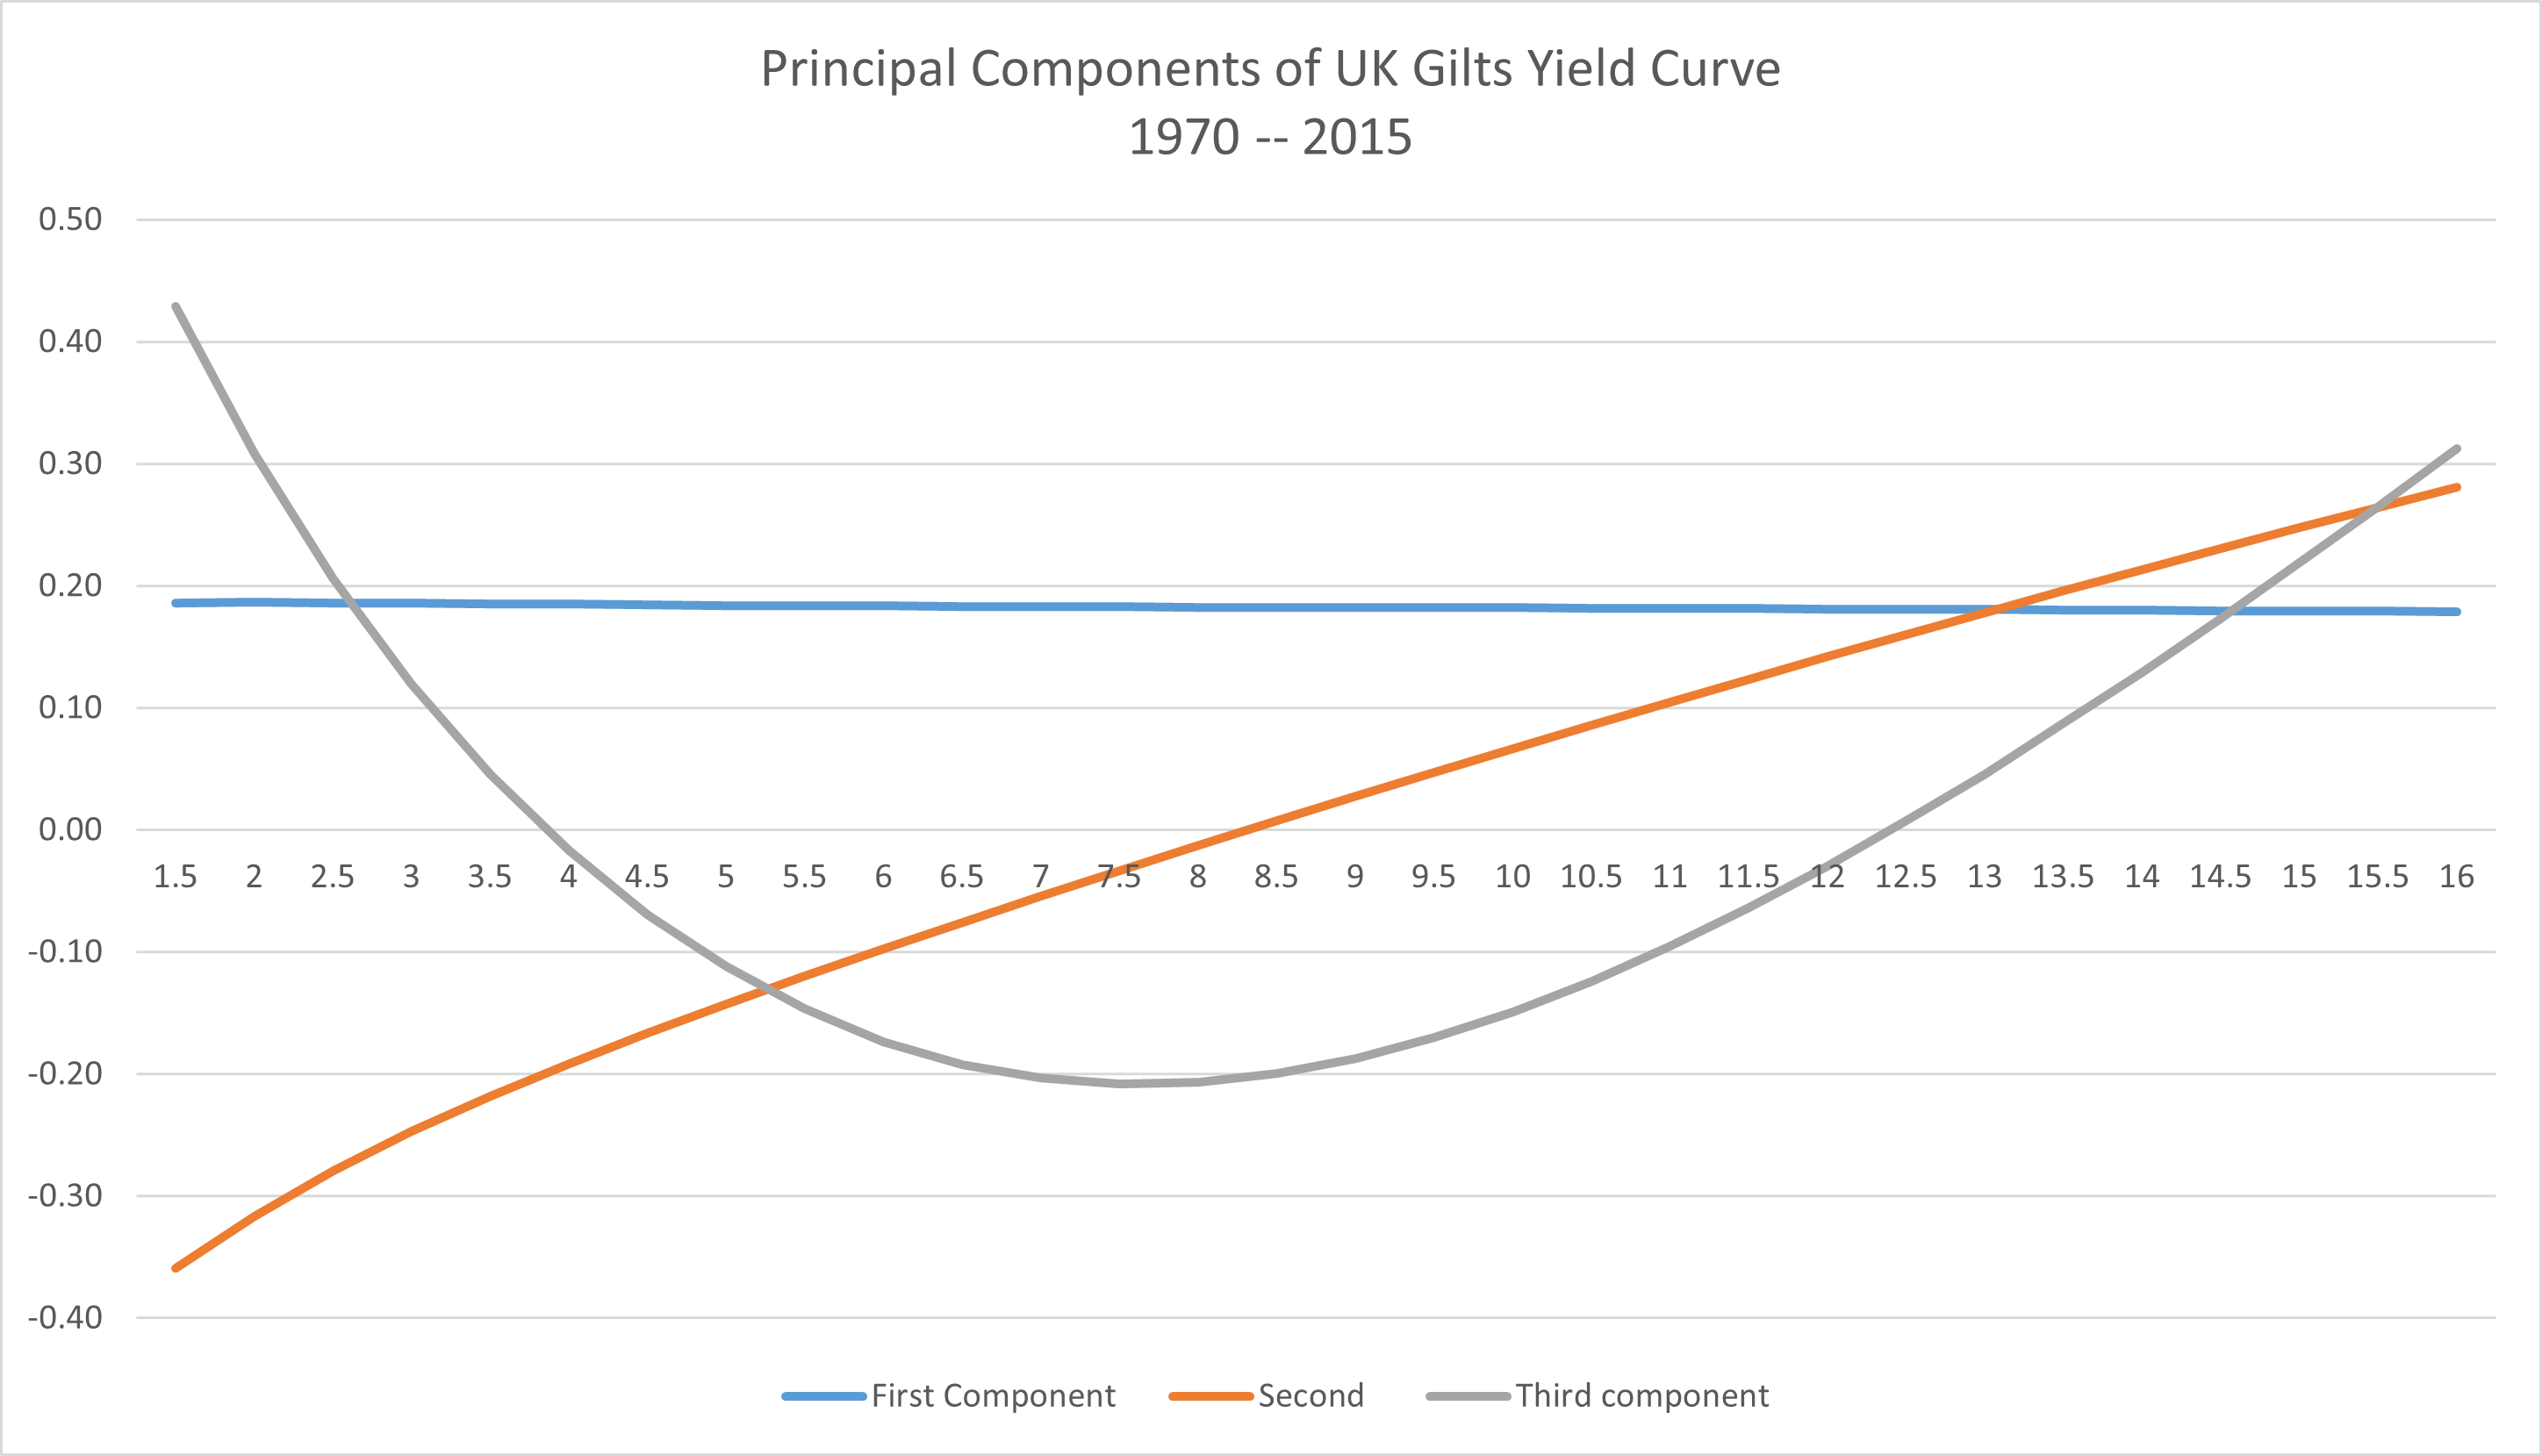
The Principal Component analysis proceeds exactly as in the blog post. The input data are simply the full date range of data of maturities between 1.5 and 16.5 years. The first three components are plotted below. The result are standard for this type analysis:
First component is a parallel shift of the curve, indicating all of the maturities changing their yield by the same amount. More than 95% of the variance is explained by this component
The second is a change in the steepness of the curve (indicating a change in the term premium)
The third component is a curvature of the curve, roughly around the 10 year maturity

Table of the first three components
For completeness the first three components are given below together with the explained variance of each:
| First | Component | Second | Third component |
|---|---|---|---|
| 1.5 | 0.19 | -0.36 | 0.43 |
| 2 | 0.19 | -0.32 | 0.31 |
| 2.5 | 0.19 | -0.28 | 0.21 |
| 3 | 0.19 | -0.25 | 0.12 |
| 3.5 | 0.19 | -0.22 | 0.05 |
| 4 | 0.18 | -0.19 | -0.02 |
| 4.5 | 0.18 | -0.17 | -0.07 |
| 5 | 0.18 | -0.14 | -0.11 |
| 5.5 | 0.18 | -0.12 | -0.15 |
| 6 | 0.18 | -0.10 | -0.17 |
| 6.5 | 0.18 | -0.08 | -0.19 |
| 7 | 0.18 | -0.05 | -0.20 |
| 7.5 | 0.18 | -0.03 | -0.21 |
| 8 | 0.18 | -0.01 | -0.21 |
| 8.5 | 0.18 | 0.01 | -0.20 |
| 9 | 0.18 | 0.03 | -0.19 |
| 9.5 | 0.18 | 0.05 | -0.17 |
| 10 | 0.18 | 0.07 | -0.15 |
| 10.5 | 0.18 | 0.09 | -0.12 |
| 11 | 0.18 | 0.10 | -0.10 |
| 11.5 | 0.18 | 0.12 | -0.06 |
| 12 | 0.18 | 0.14 | -0.03 |
| 12.5 | 0.18 | 0.16 | 0.01 |
| 13 | 0.18 | 0.18 | 0.05 |
| 13.5 | 0.18 | 0.20 | 0.09 |
| 14 | 0.18 | 0.21 | 0.13 |
| 14.5 | 0.18 | 0.23 | 0.17 |
| 15 | 0.18 | 0.25 | 0.22 |
| 15.5 | 0.18 | 0.26 | 0.27 |
| 16 | 0.18 | 0.28 | 0.31 |
| ExplVar | 389.67 | 8.35 | 0.49 |
Data used
- BOE Monthly Archival Spot Gilts Yield Curve, from https://www.bankofengland.co.uk/-/media/boe/files/statistics/yield-curves/glcnominalmonthedata.zip
Copyright: B. Nikolic 2024. For general information only. Not to be relied for any purpose. Not advice about investment. No warranty of any kind. No liability for any use of this information accepted.